


Web Augmented Reality (WebAR) is a burgeoning business. From a $3.98 billion market in 2019, WebAR grew to $6.16 billion in 2020. It’s projected to reach $21 billion by 2024. Currently, enterprise productivity is the main driver of WebAR. It consists of tools used to train or enhance worker skills and enhance employee engagement with the company. Enterprise productivity generated $2.58 billion in 2020, followed by AR advertising at $1.41 billion and consumer in-app purchases ($1.38 billion).
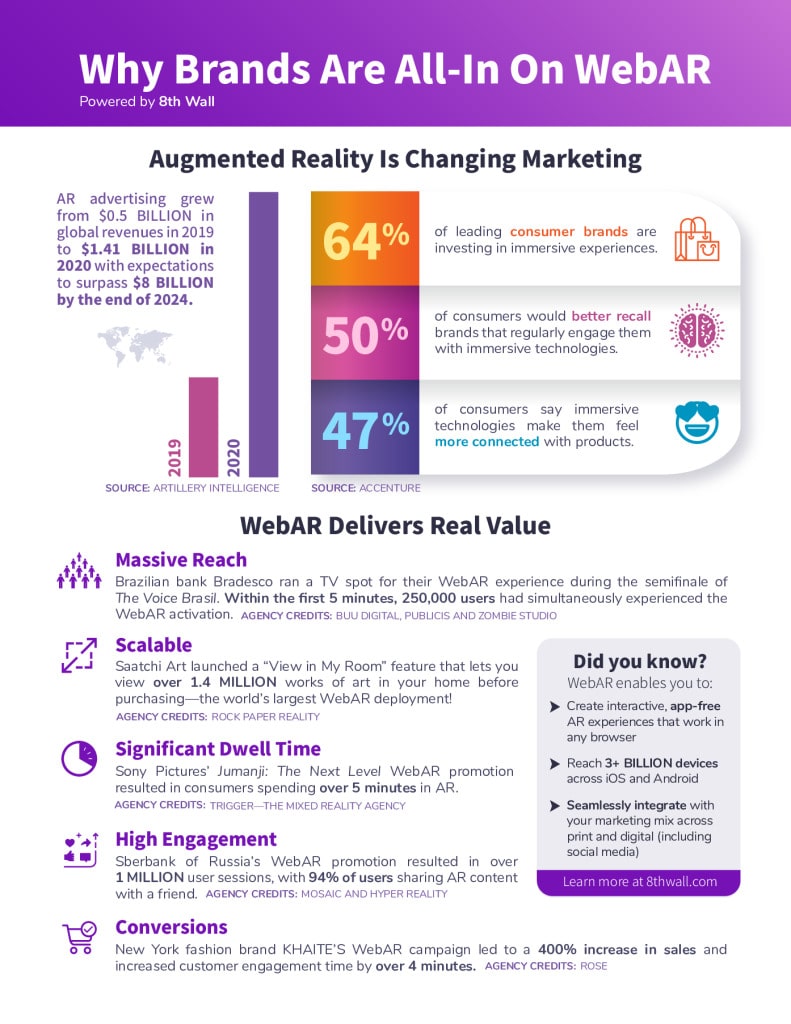
AR advertising offered the biggest potential for growth and was projected to overtake enterprise productivity as the leading revenue earner by 2024. ARtillery projects that AR advertising will reach $8.02 billion by 2024. Meanwhile, Enterprise productivity will regress and end up with $3.78 billion.
Why does advertising have the biggest potential? According to data from Accenture:
- 64% of leading consumer brands are investing in immersive activities
- 50% of consumers better recall brands that regularly engage them using immersive technologies
- 47% of consumers say immersive technologies make them feel more connected to products
In order to maximize this potential, you need to determine the performance of your current AR products and campaigns. The best way to do this is to leverage WebAR analytics.
Let’s chat
Not sure where to start? Book a free strategy call with us to get started! No strings attached.

What Does WebAR Analytics Measure?

Low engagement or low dwell times can signal a weak WebAR experience.
WebAR outperforms social media apps in terms of evaluating performance when it comes to analytics. There are the requisite engagement rate factors like views, likes, and shares. At the same time, metrics designed for WebAR experiences like dwell time and spatial analytics help gauge interest and engagement. Below are some of the common WebAR metrics that help determine if an experience made an impact or is largely left ignored.
Pageviews
Pageviews are the basic starting points in any analytics report. They are what happens when a browser loads a page on your site. Every load event, including refreshing the page, is counted as a single view. Analytics can count page views from a single user (IP address) to record users’ frequency and return rate. This data can help determine the replay value of the WebAR experience. The better the replay value, the more cost-effective the WebAR investment is. Also, page views can also help evaluate campaign materials’ effectiveness that convinces people to scan a QR or a tap a link to the WebAR experience.
Dwell Time
Dwell time is the time spent immersed in the WebAR experience. It helps determine how much time users are engaged. If a WebAR experience runs for three minutes and users drop at the one-minute mark, the quality of the experience may need some tweaking. Load times can also be a factor here, as the average dwell time for users after clicking a link is two minutes. Consequently, the longer it takes for a WebAR experience to start, the greater the danger of users losing interest to continue.
At the same time, a more compelling experience with better visuals, gameplay, and script, will win over users versus one that is poorly created and directed. Dwell time can help determine this as well.
Engagement Rate
Engagement rate is a social metric that measures the level of interaction of a WebAR content among its. Instead of simply counting the number of likes, shares, and comments, it follows a formula that divides total interactions by the number of followers and then multiplied by 100. This provides a better, more accurate measurement of content performance compared to absolute measures such as likes, shares, and comments.
Spatial Analytics
Spatial analytics is a new and advanced analytics feature exclusive to AR and VR experiences. It allows a deeper look into AR campaigns by breaking down elements within the WebAR content. Spatial analytics track and record user behavior inside the 3D environment. It helps determine which areas or objects get the most interactions. Inversely, it also determines which areas are least visited and which objects may need to either be repositioned or replaced.
Keep up to date
Sign up to our newsletter for exclusive updates and content, delivered directly to your inbox.
Google Analytics in WebAR

For WebAR experiences, allowing camera access is a signal that users want to engage.
Google Analytics already established its set of metrics to help measure a site’s popularity. WebAR content can use these metrics to paint a more detailed picture of their performance.
In particular, WebAR experiences use the following Google Analytics metrics:
- Visits – Visits occur when an external site sends a user to a WebAR site. Whether it’s because the user clicked a link or used a search engine, the action of getting directed to the target site is called a visit.
- Unique Visitors – This metric provides insight on how many individual visitors went to the WebAR experience. In comparison, visits count the aggregate number of site arrivals. It does not factor in how many times a single user visited the site. Unique visitors solve that issue by counting each unique visitor once after a certain period of time. Once that time lapses, a new count will be made even if the user is a previous visitor.
- Number of Users Who Allowed Access to the Camera – Given that the WebAR experience requires the use of a camera, the metric that records the number of visitors who allowed access to the camera gives an accurate picture of the WebAR’s acceptance rate to play. Rejecting the request for camera access is equivalent to abandoning the experience before it even started.
Know Your WebAR Metrics
Getting familiar with the metrics that measure the effectiveness of WebAR experiences provides companies and brands to gauge consumer interest in their content. A high view/visit rate but low engagement or low dwell time may mean the need for more compelling materials.
Meanwhile, spatial analytics can weed out uninteresting parts of the Augmented Reality landscape, which can be replaced with more dynamic elements. Google Analytics metrics can also help gauge the effectiveness of campaigns by registering visitors and unique visitor rates. Camera access can help determine if visitors completed the WebAR experience or abandoned it before it even started.
Learn more about how Web Augmented Reality can help produce engaging and immersive content for your company’s product and marketing campaigns. Rock Paper Reality is an Augmented Reality design agency that lets you unlock the magic of AR and help boost your bottom line. Learn more about how Rock Paper Reality can make AR work for you. Contact us today for a free demo.